- Articles
- 48
- PDF Downloads
- 56,099
- Total Usage
- 119,296
- Latest Activity 20 Aug 2026
- 485
- This Month
- 10,171
Journal Impact and Statistics
MSA Citation Impact and Scholarly Visibility
This page presents selected citation and impact indicators for Management Science Advances (MSA). The statistics summarize citation visibility across major scholarly databases, average citation performance, citation impact by publication cohort, the breadth of citation recognition among MSA publications, and the citation performance of the journal's leading articles.
Citation Overview
Citation data for MSA are available from Google Scholar, Scopus, and Web of Science. The source data and citation profiles can be accessed directly below.
Citations based on the available database records:
- Total citations ( Google Scholar ): 357
- Total citations ( Scopus ): 156
- Total citations ( Web of Science ): 91
Average Citations per Published MSA Article
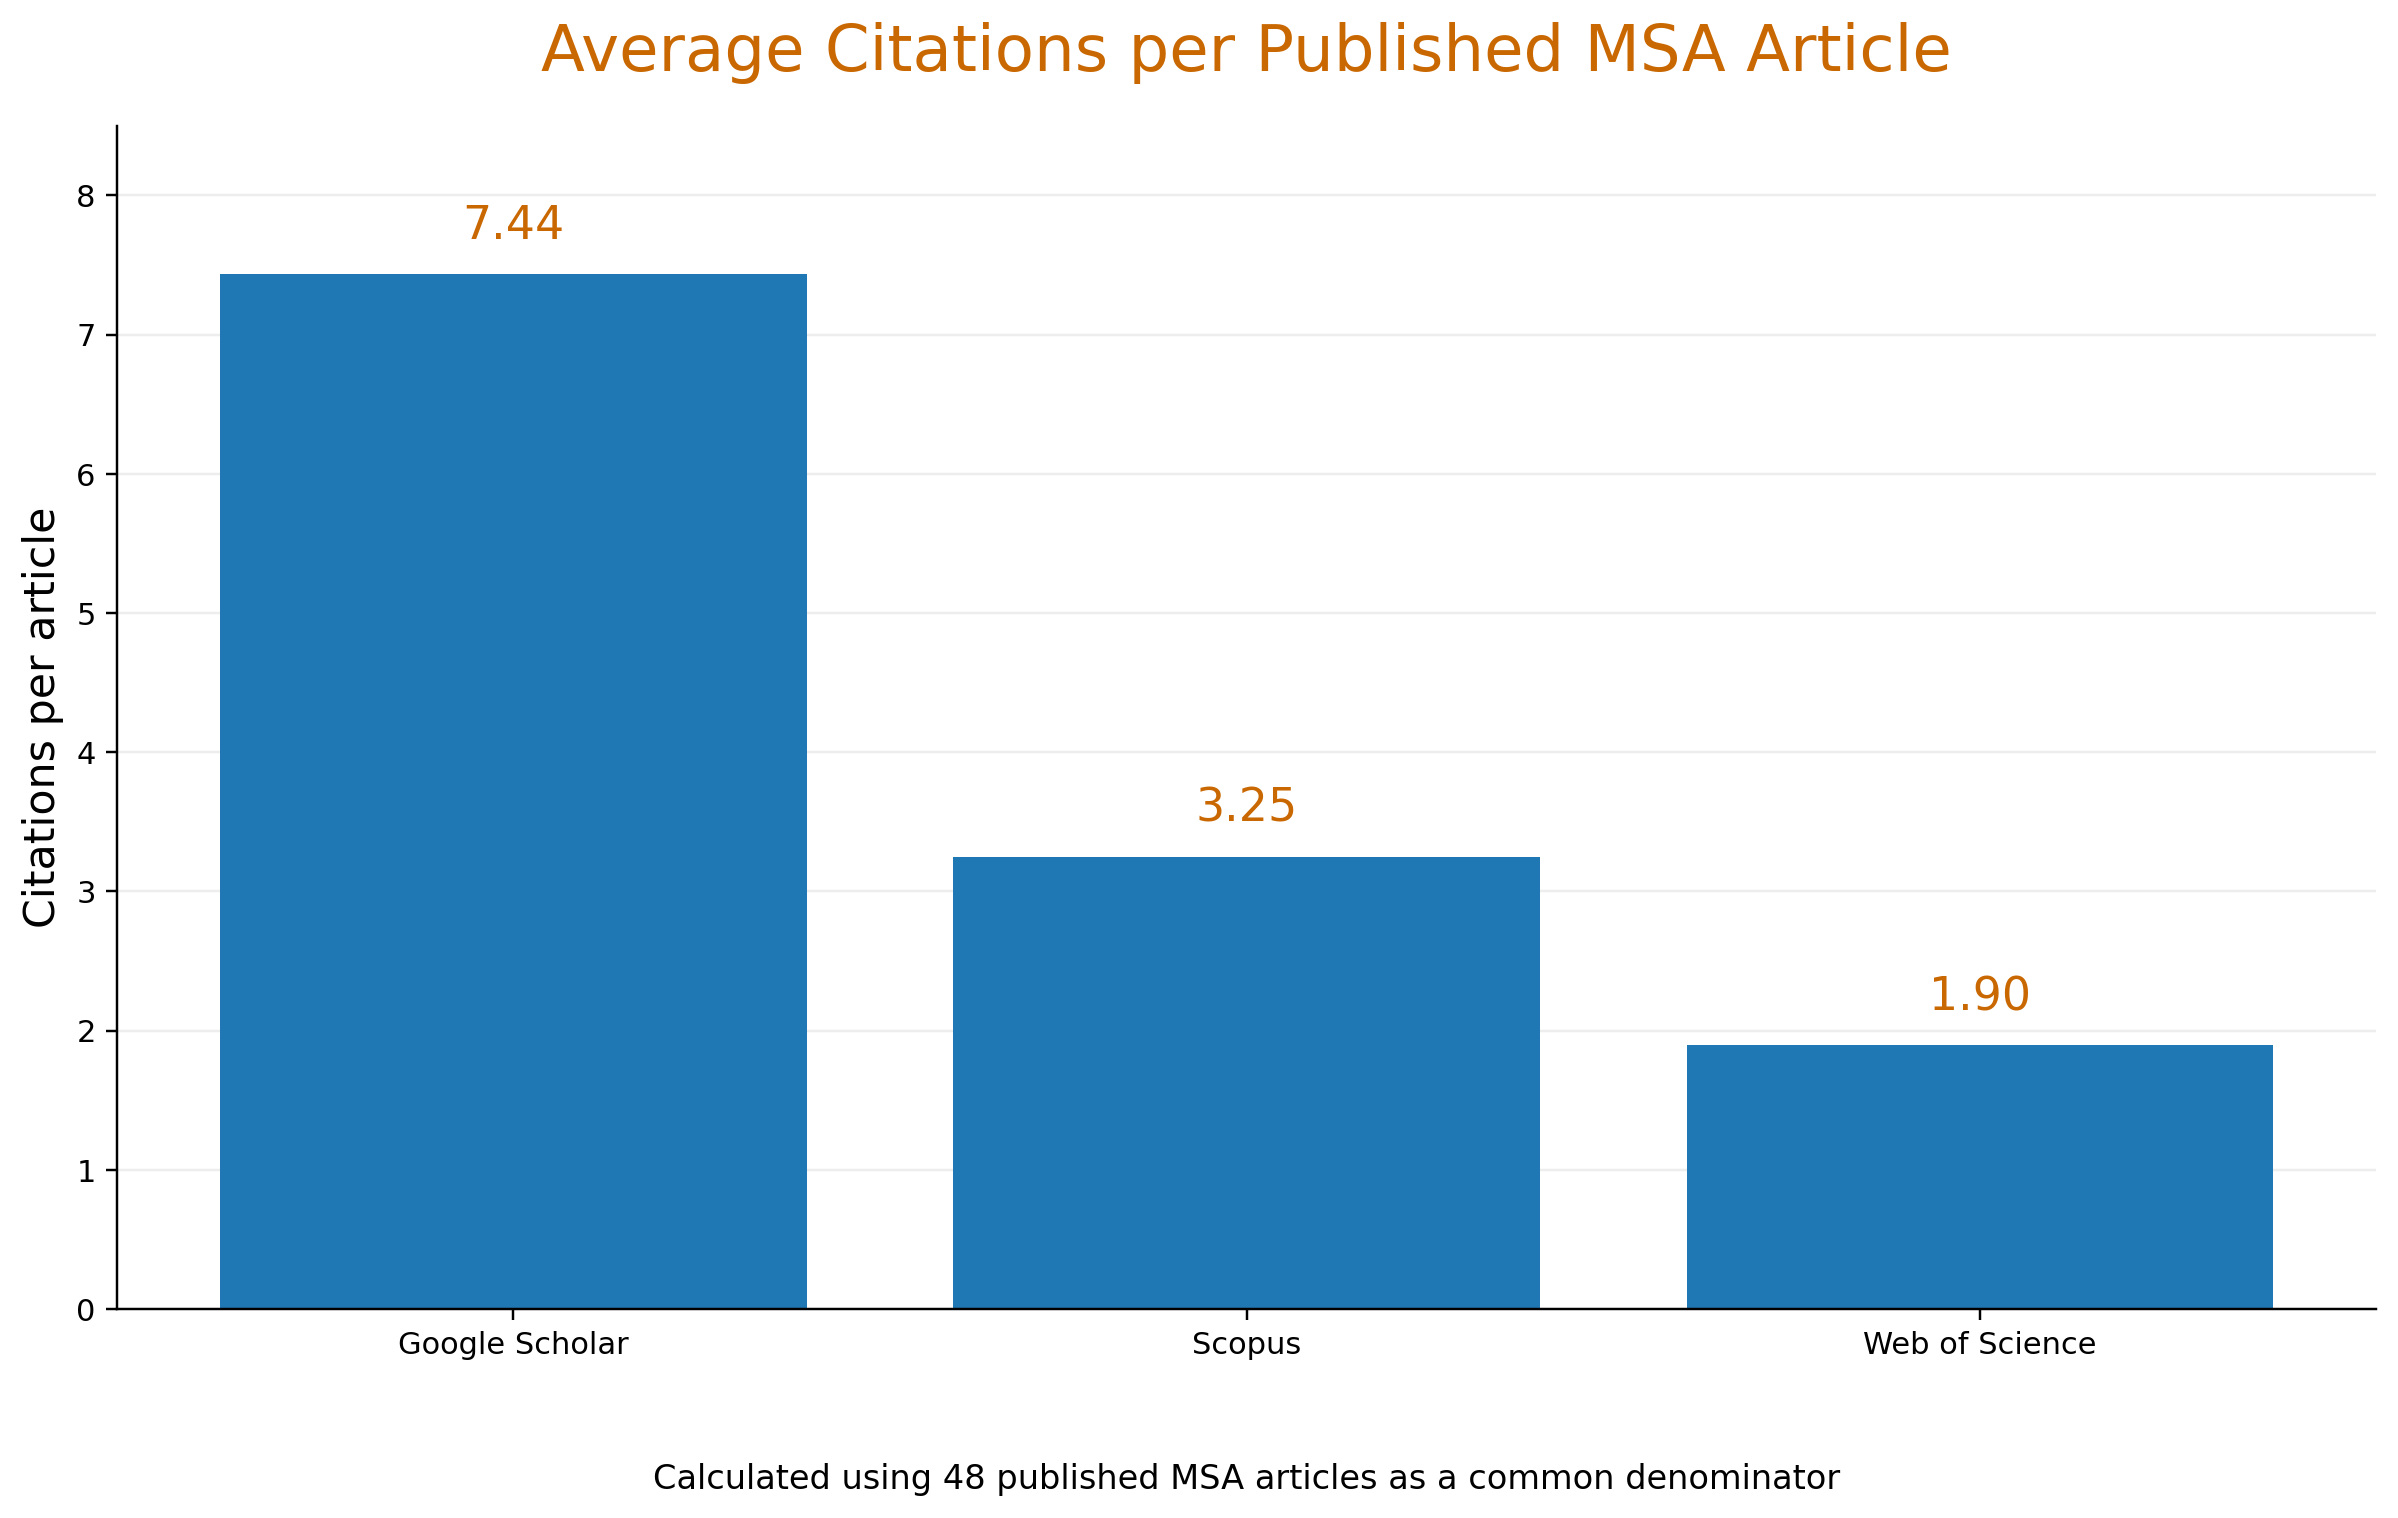
To provide a directly comparable indicator across the three databases, the total number of citations in each database is divided by the same denominator of 48 published MSA articles. This produces an average of 7.44 citations per article in Google Scholar, 3.25 in Scopus, and 1.90 in Web of Science.
Using the same denominator is important because it makes the three values directly comparable. The higher Google Scholar average reflects its broader coverage of scholarly sources, while the more selective Scopus and Web of Science databases return lower citation counts.
Click the figure to enlarge
Citation Visibility Across Major Scholarly Databases
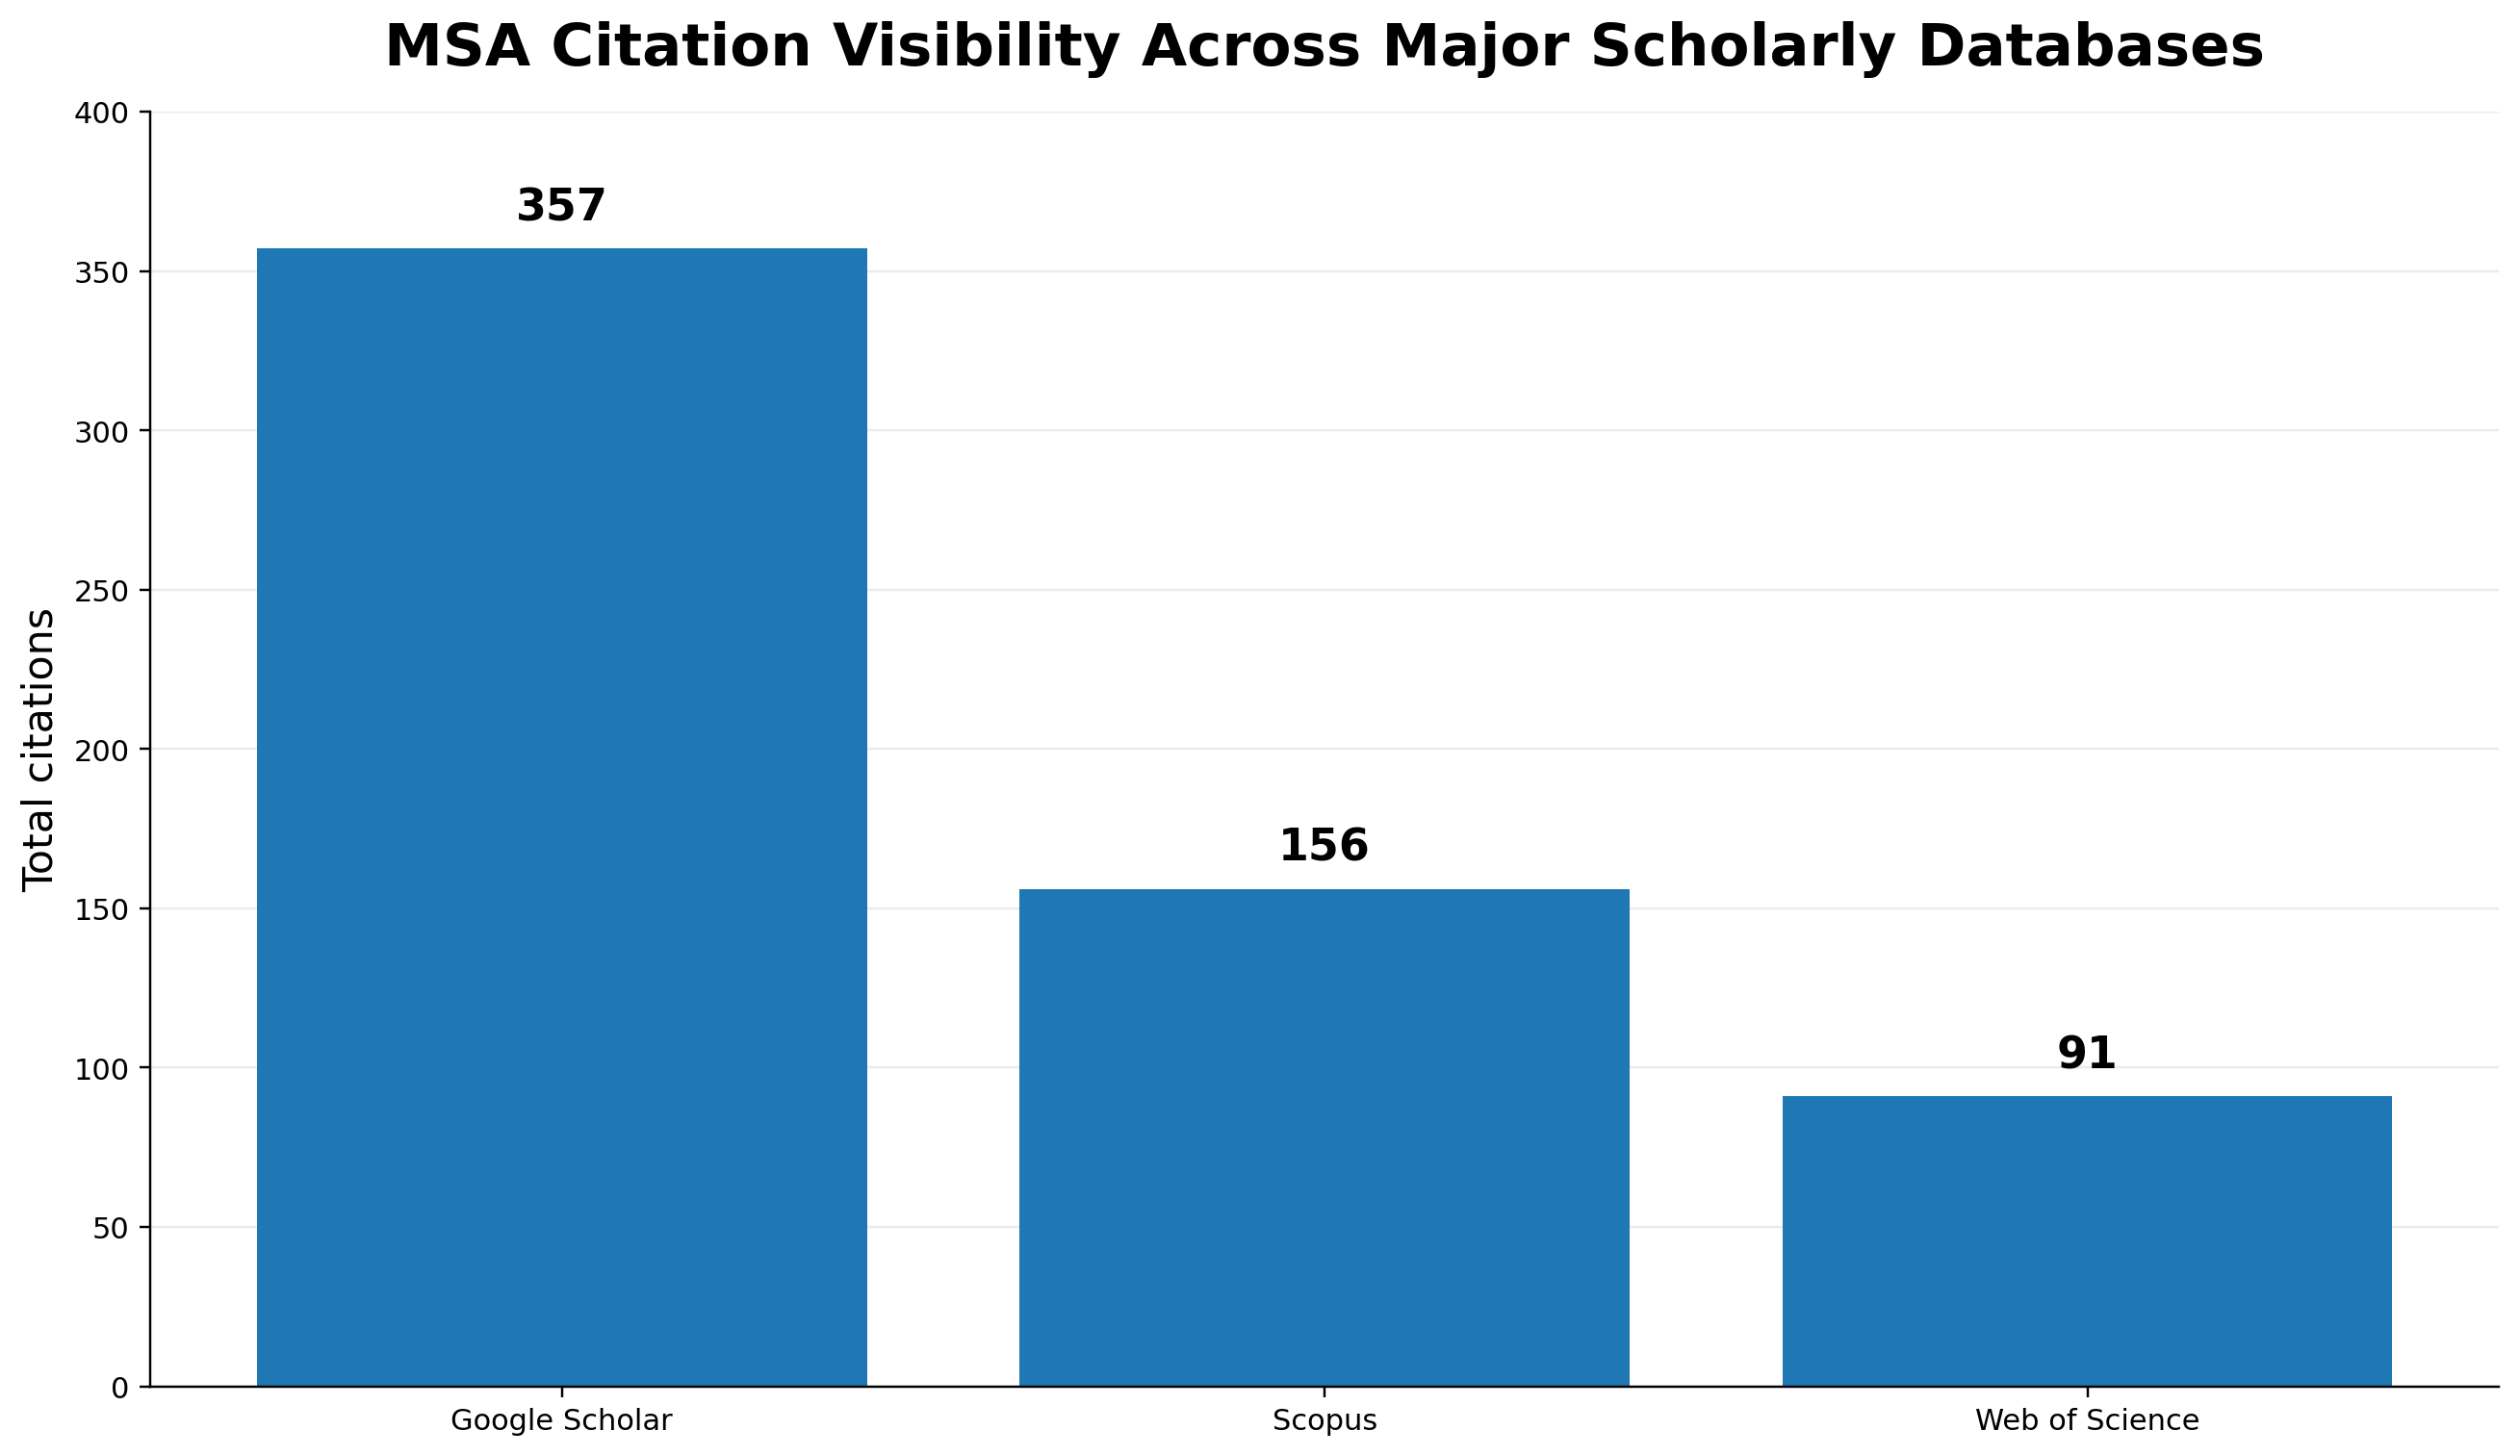
MSA demonstrates citation visibility across multiple independent scholarly databases. Google Scholar records 357 citations, Scopus records 156 citations, while Web of Science records 91 citations.
The figure should be interpreted as a comparison of the journal's visibility across different bibliographic environments rather than as a comparison of identical citation universes. Differences are expected because each database applies different indexing criteria, source coverage, and citation-recording procedures.
Click the figure to enlarge
Citation Impact by MSA Publication Cohort
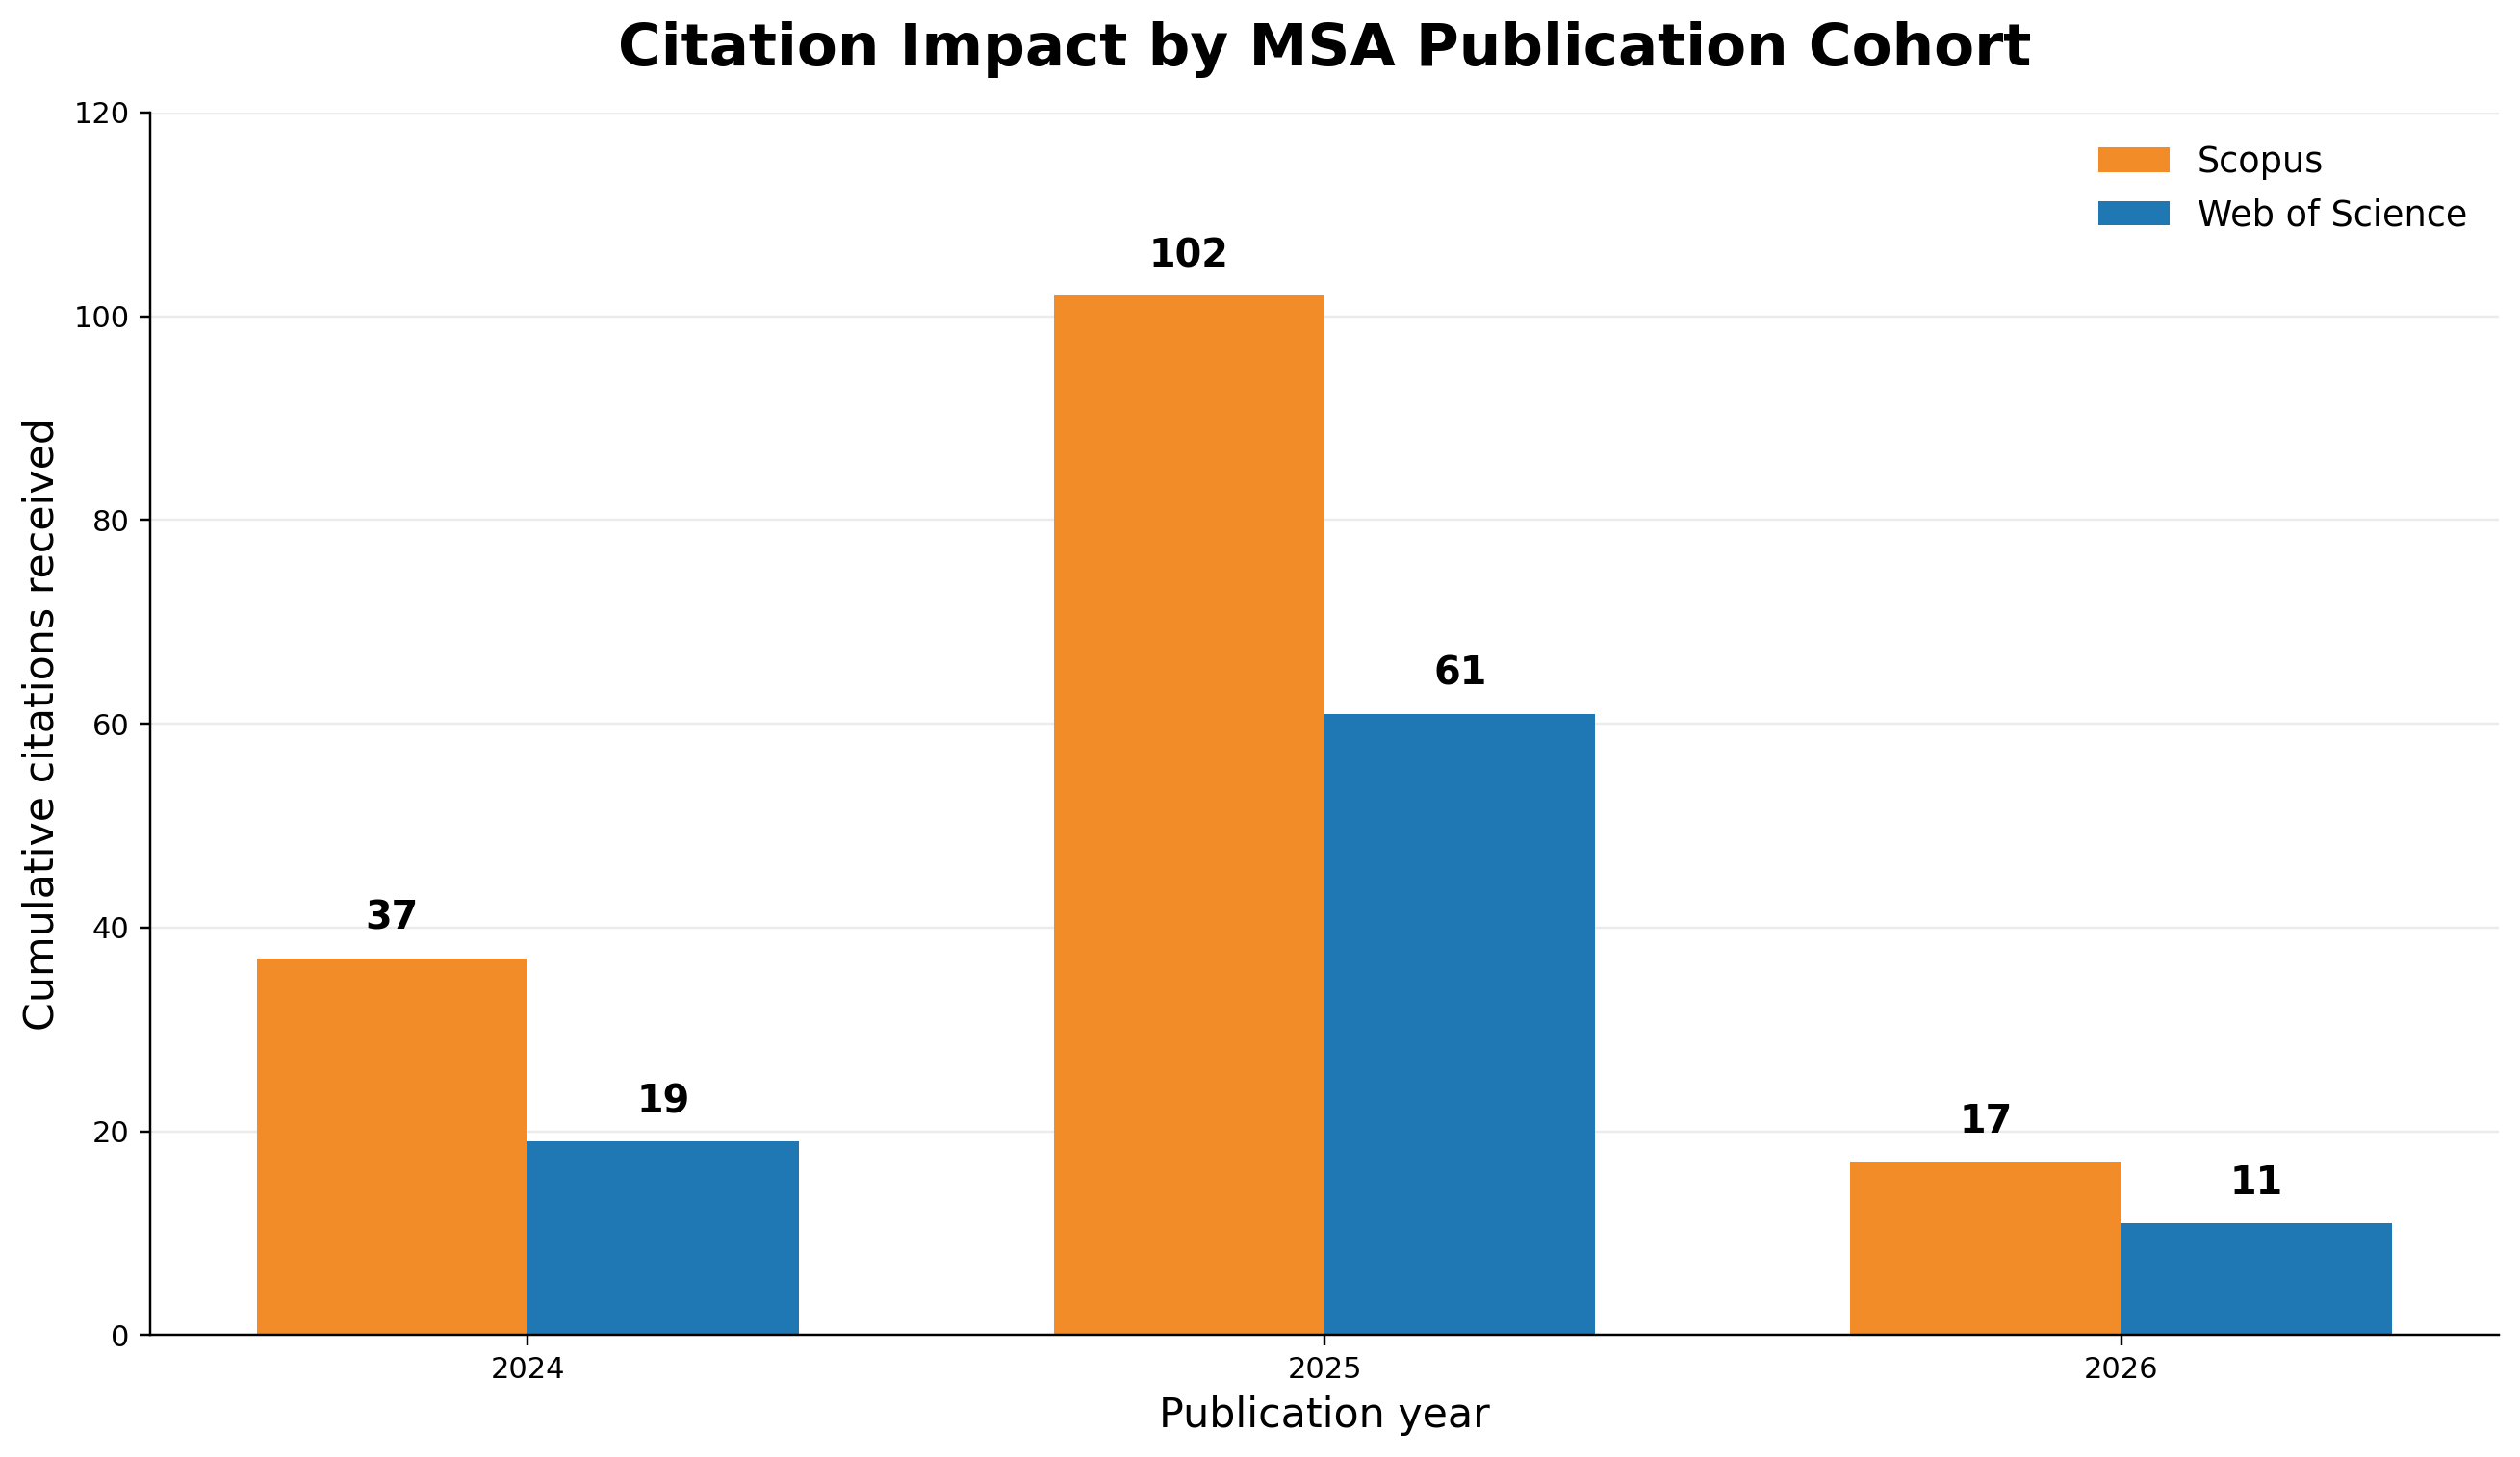
This figure reports the cumulative number of citations received by MSA articles grouped according to their year of publication . It does not represent the number of citations generated during each calendar year.
According to the analyzed Scopus records, articles published in 2024 accumulated 37 citations, those published in 2025 accumulated 102 citations, while papers published in 2026 accumulated 17 citations. The corresponding Web of Science values are 19, 61, and 11 citations.
The comparatively lower citation count for the 2026 publication cohort is expected because these articles have had a substantially shorter period in which to accumulate citations. It should therefore not be interpreted as evidence of weaker citation performance.
Click the figure to enlarge
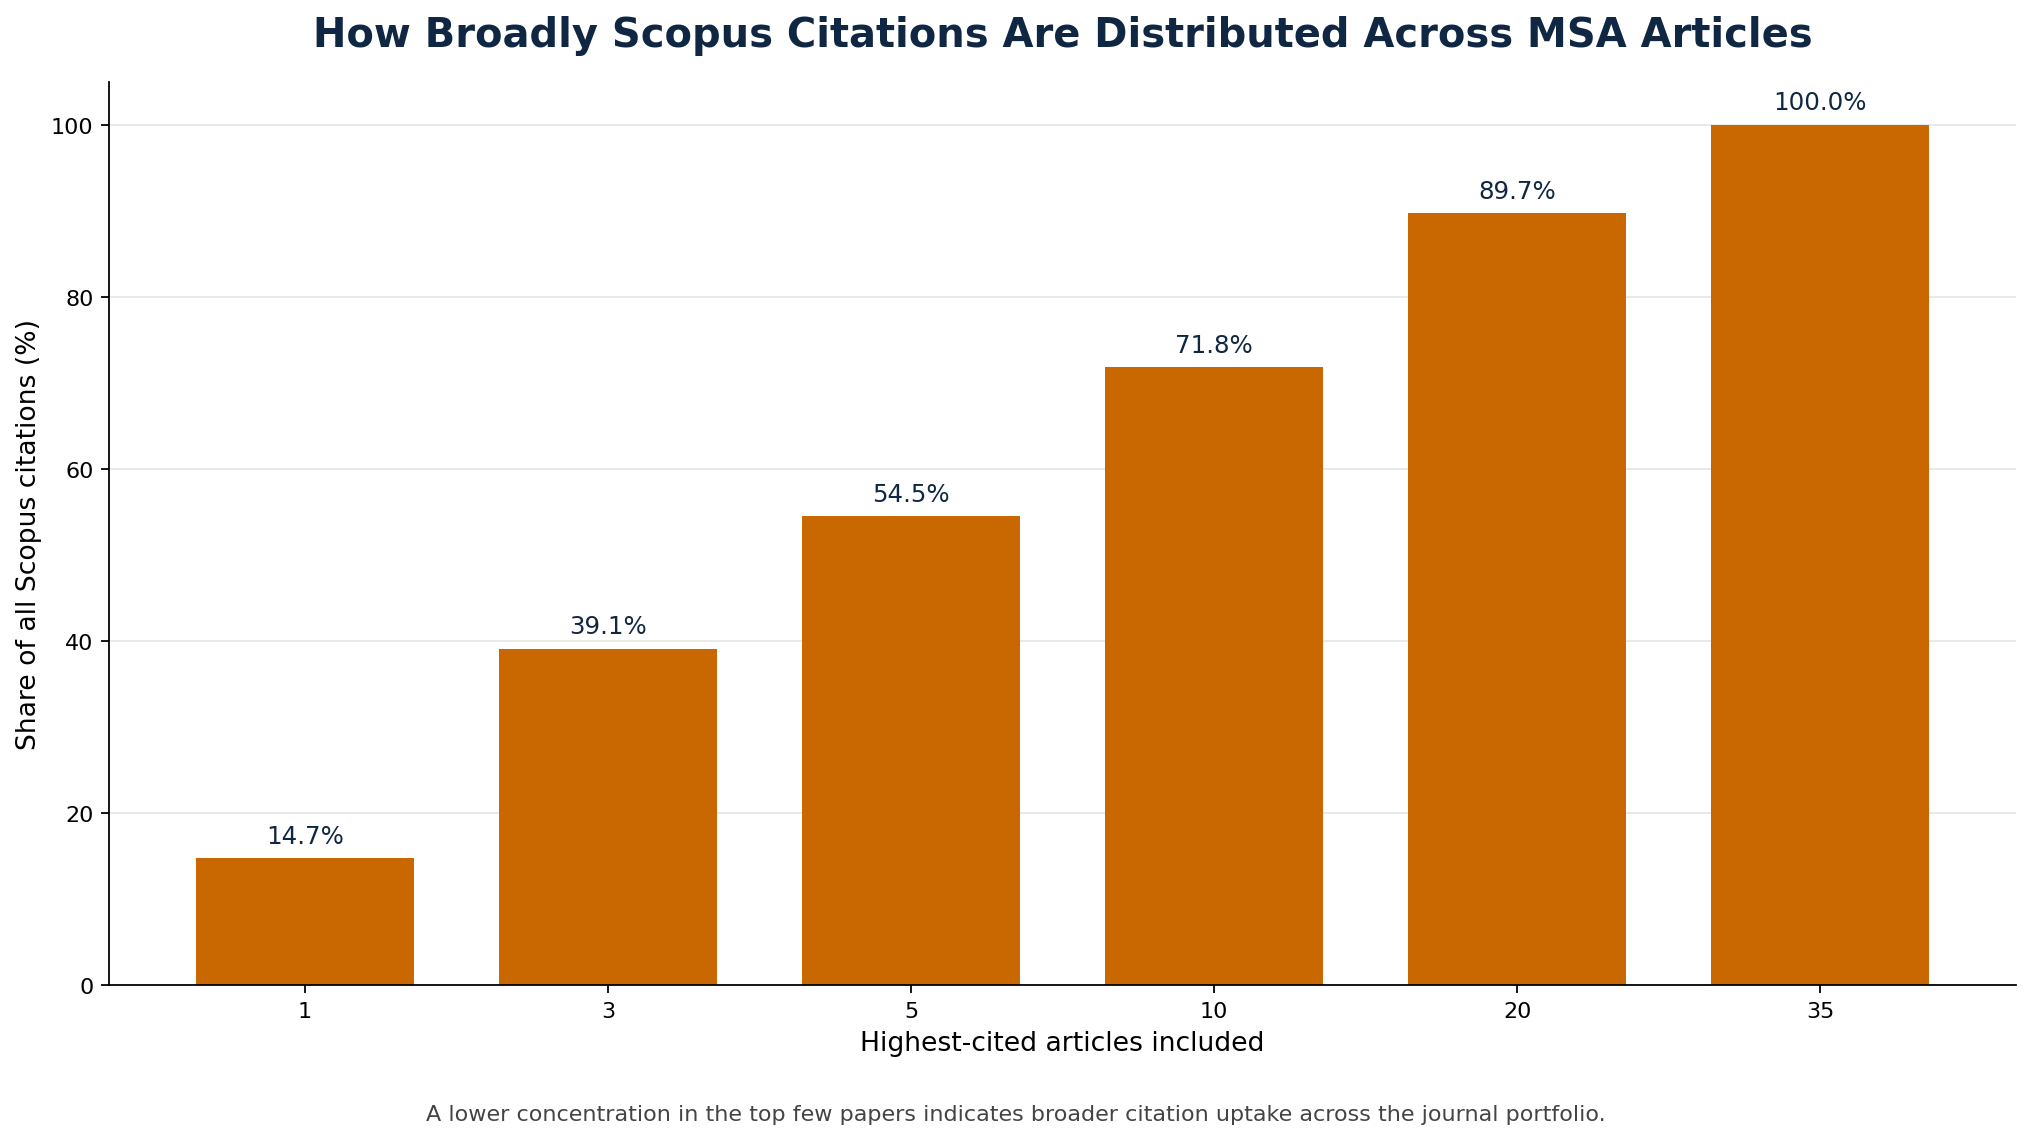
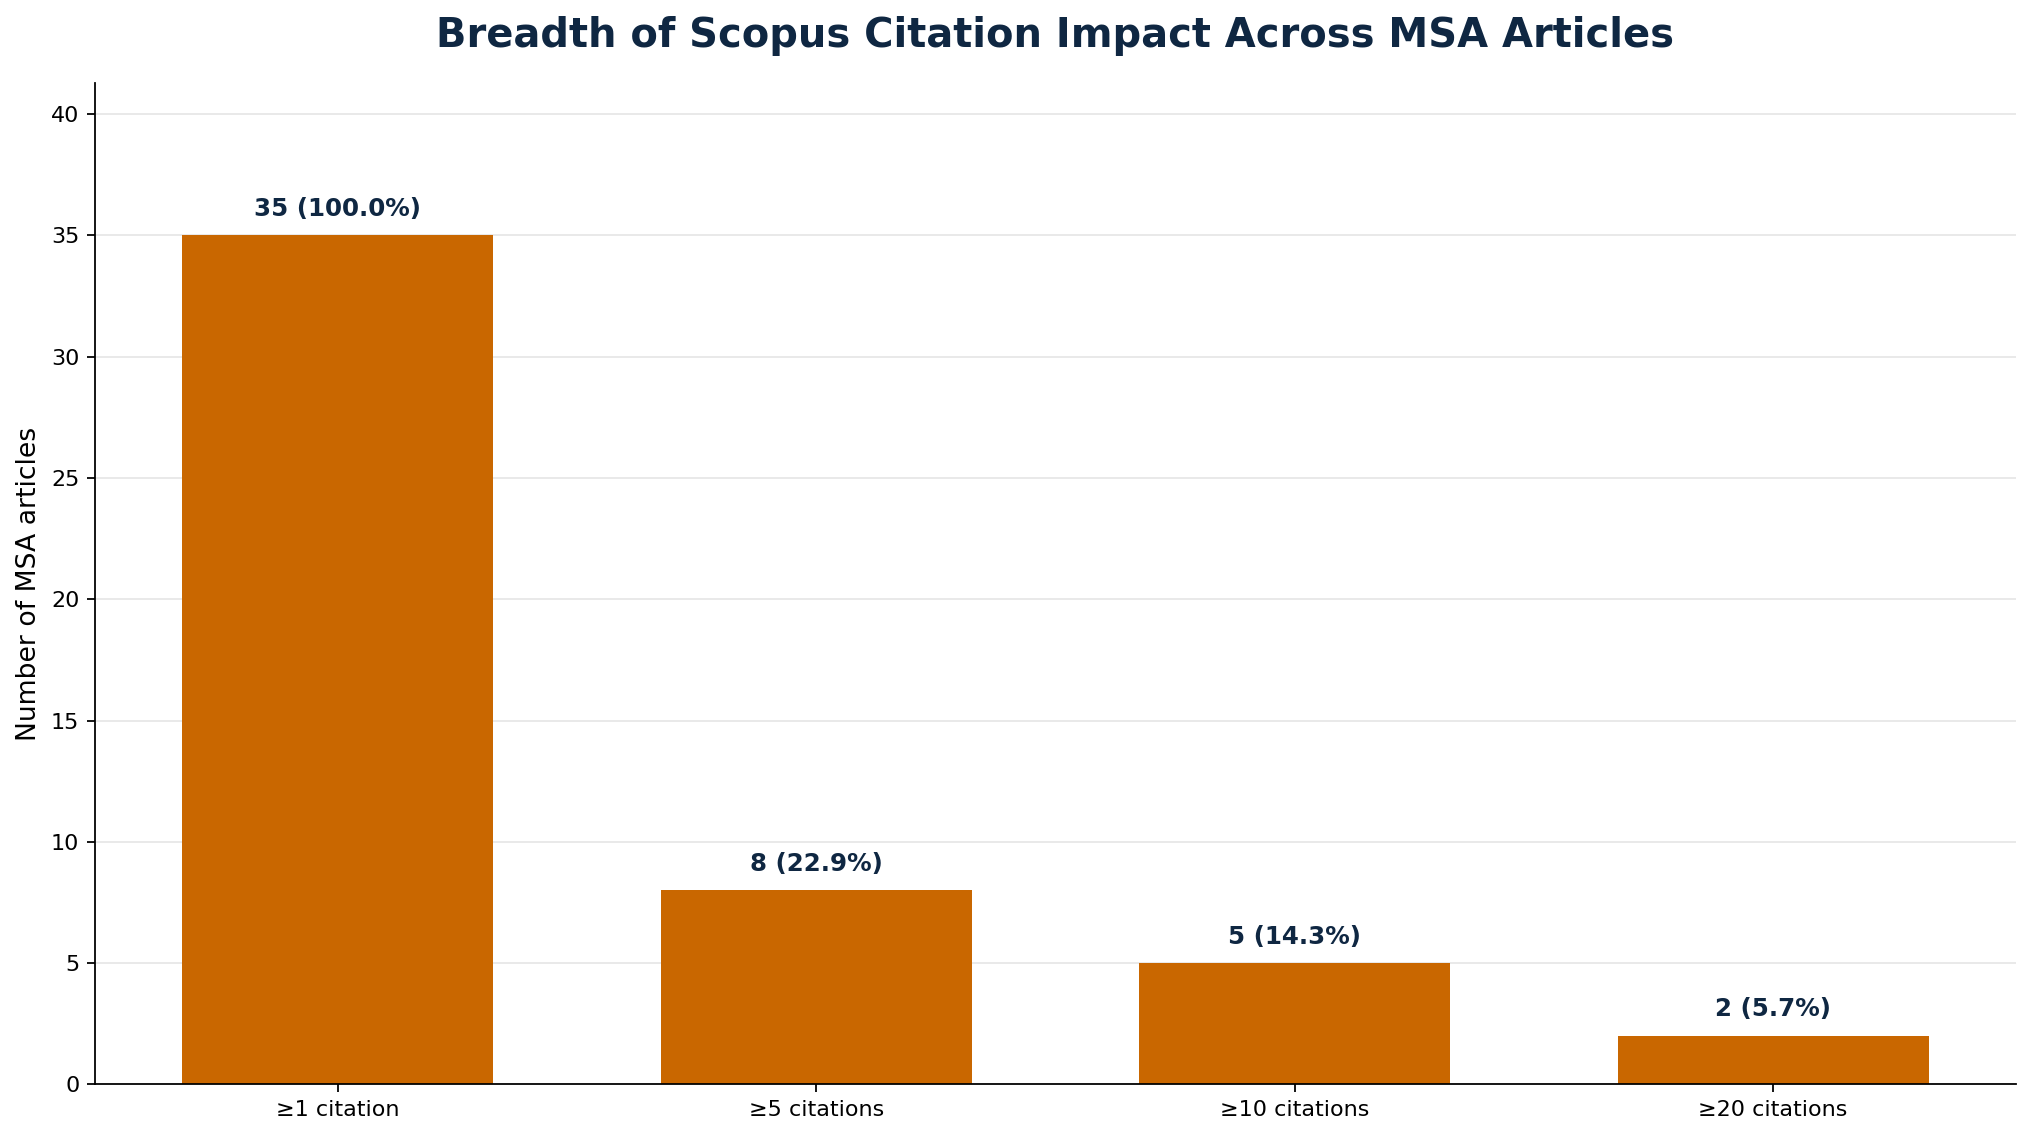
Breadth of Scopus Citation Impact
Citation impact is distributed across a substantial part of the MSA publication portfolio. According to the analyzed Scopus records, 35 publications have received at least one citation, 8 publications have received at least five citations, 5 publications have received at least ten citations, and 2 publications have received 20 or more citations.
This indicator measures the breadth of citation recognition rather than only the performance of a small number of highly cited papers. The results therefore provide an indication of how widely citation impact is distributed across the journal's publication portfolio.
Click the figure to enlarge
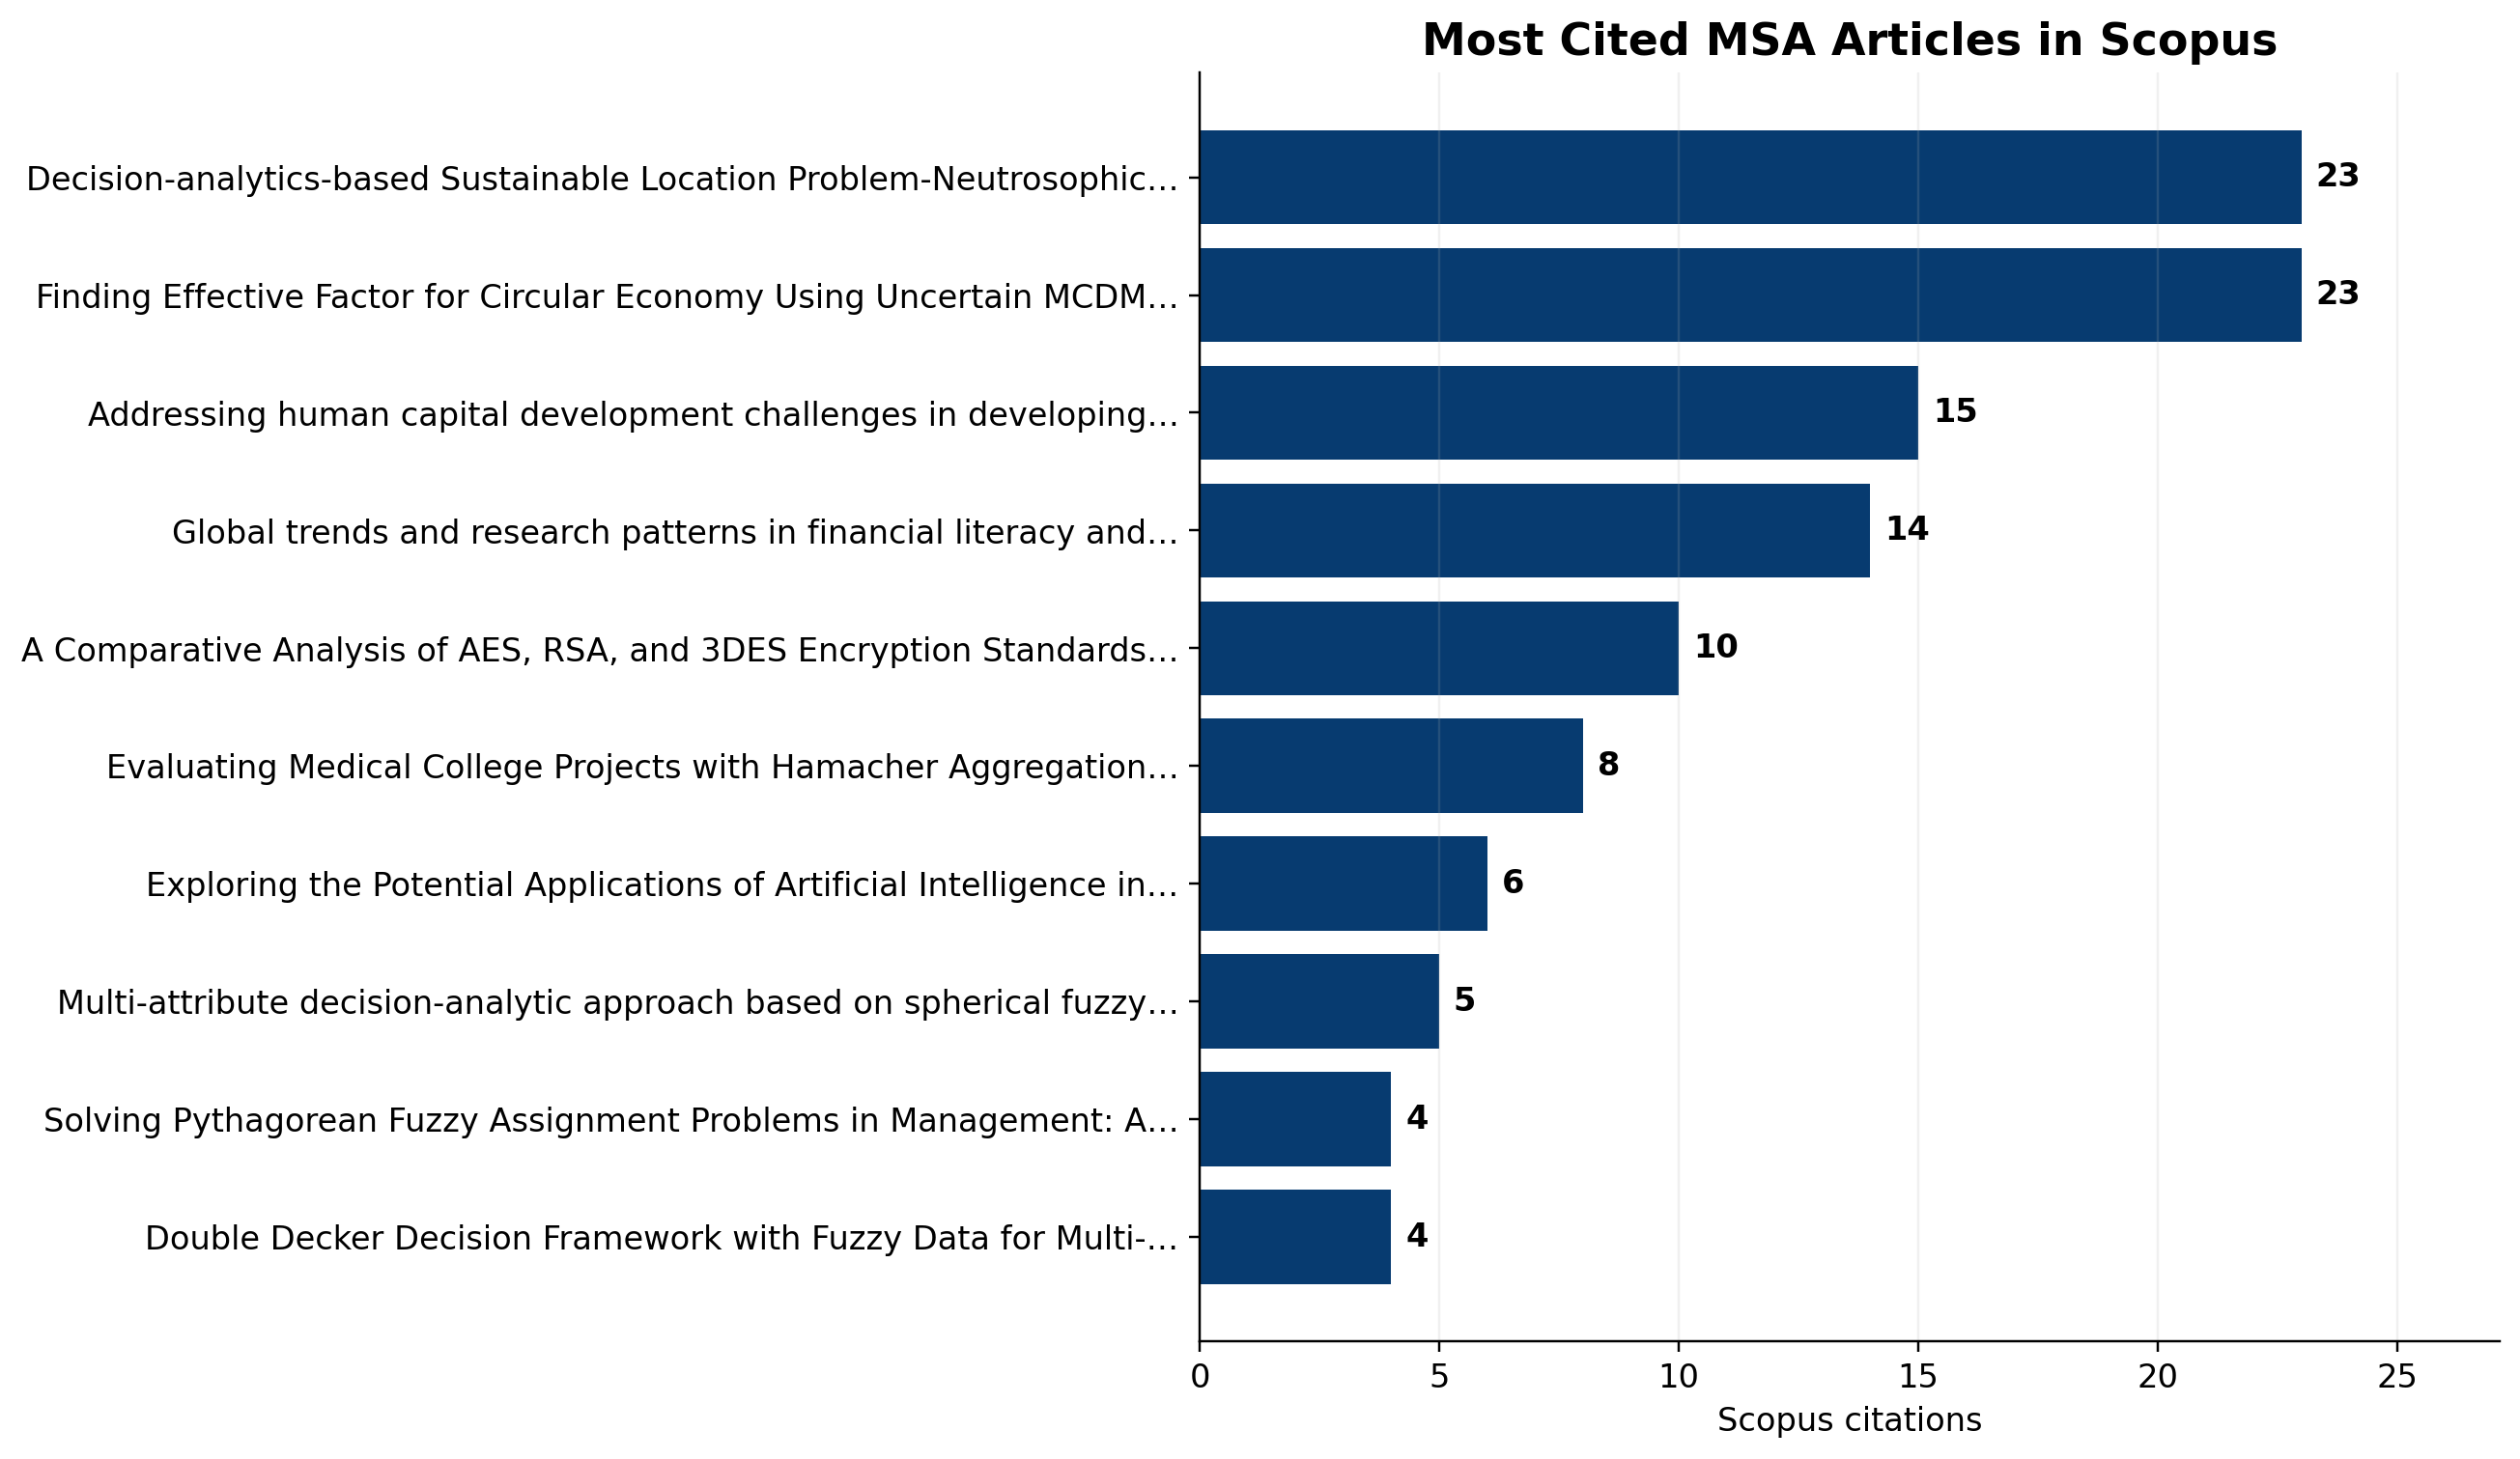
Most Cited MSA Articles in Scopus
The figure presents the ten MSA articles with the highest citation counts in Scopus. The ranking provides a more detailed view of the individual publications that currently make the strongest contribution to the journal's Scopus citation impact.
The two leading articles have each accumulated 23 Scopus citations. They are followed by publications with 15, 14, 10, 8, 6, 5, 4, and 4 citations. The distribution is important because it shows that the journal's citation performance is supported by several papers rather than by a single exceptionally cited article.
The leading publications also cover different research topics, indicating that scholarly attention to MSA is distributed across several areas represented within the journal's scope. Because these are cumulative citation counts, the ranking may change as newer papers have more time to accumulate citations.
Click the figure to enlarge
Publication-year statistics represent citations accumulated by articles published in a particular year , rather than citations received during that calendar year.
Citation counts for individual articles should also be interpreted in relation to their publication date. More recently published articles have had less time to accumulate citations, and their current citation counts are therefore not directly comparable with older publications without considering the different citation windows.
Scopus source data: MSA Scopus dataset
Web of Science source data: MSA Web of Science dataset
Google Scholar profile: Management Science Advances